Graficar desde consola
index | about | archive | charlas | docs | links
dot |
git |
img |
plt |
tty |
uml
barra
Páginas más solicitadas
ssh osiux 'cat osiux.com-access.log | grep -Eo "GET /.*HTTP" | sed s/HTTP//g | cut -c 5- | egrep -v "(img|tmb|css|robots|ico)" | sort | uniq -c | sort -nr | head' | barra
 60.18 %  60.18 %       461 ██████████████████████████████ /
 75.98 %  15.80 %       121 ████████ /feed
 79.77 %   3.79 %        29 ██ /2014-03-14-saso-conf-curuzu-cuatia.html
 83.03 %   3.26 %        25 █ /index.html
 86.16 %   3.13 %        24 █ /painless-backups-using-rdiff-backup
 89.16 %   3.00 %        23 █ /visualizando-org-mode-con-gnuplot.html
 92.04 %   2.87 %        22 █ /docs.html
 94.78 %   2.74 %        21 █ /que-no-se-entere-nadie.html
 97.39 %   2.61 %        20 █ /todo-txt-rst+org-mode.html
100.00 %   2.61 %        20 █ /blog.html
                        766
Códigos de error HTTP
ssh osiux 'cat osiux.com-access.log | egrep -o " [0-9]{3} "' | sort | uniq -c | sort -nr | barra
 66.78 %  66.78 %      3225 █████████████████████████████████ 200
 86.75 %  19.96 %       964 ██████████ 404
 99.34 %  12.59 %       608 ██████ 304
 99.98 %   0.64 %        31 ▌ 206
100.00 %   0.02 %         1 ▌ 400
                       4829
Análisis de user-agent
ssh osiux 'cat osiux.com-access.log | cut -d\" -f6 | cut -d" " -f1 | sort | uniq -c | sort -nr' | head -20 | barra
 86.82 %  86.82 %      4188 ███████████████████████████████████████████ Mozilla/5.0
 90.84 %   4.02 %       194 ██ Mozilla/4.0
 93.06 %   2.22 %       107 █ msnbot-media/1.1
 95.02 %   1.97 %        95 █ Googlebot-Image/1.0
 96.64 %   1.62 %        78 █ Opera/9.80
 97.53 %   0.89 %        43 ▌ Claws
 97.97 %   0.44 %        21 ▌ SAMSUNG-SGH-E250/1.0
 98.38 %   0.41 %        20 ▌ DoCoMo/2.0
 98.63 %   0.25 %        12 ▌ Sogou
 98.86 %   0.23 %        11 ▌ www.adressendeutschland.de
 99.07 %   0.21 %        10 ▌ Feedly/1.0
 99.25 %   0.19 %         9 ▌ -
 99.42 %   0.17 %         8 ▌ Python-urllib/2.6
 99.59 %   0.17 %         8 ▌ Googlebot/2.1
 99.67 %   0.08 %         4 ▌ WebIndex
 99.75 %   0.08 %         4 ▌ Google-HTTP-Java-Client/1.17.0-rc
 99.83 %   0.08 %         4 ▌ facebookexternalhit/1.0
 99.90 %   0.06 %         3 ▌ facebookexternalhit/1.1
 99.96 %   0.06 %         3 ▌ curl/7.21.0
100.00 %   0.04 %         2 ▌ W3C_Validator/1.3
                       4824
block-diag
diagram {
 default_node_color = 'black';
 default_linecolor = '#cfff00';
 default_textcolor = '#cfff00';
 default_fontsize = 14;
 span_width = 100;
 span_height = 60;
 node_height = 40;
 node_width = 130;

 inet [shape = cloud];
 inet -- osiux;

 network BuenosAiresLibre {
     address = "10.4.14.x/224"
     osiux [address = "10.4.14.225"]
     aleosi [address = "10.4.14.251"]
     eosial [address = "10.4.14.250"]
     osiale [address = "10.4.14.226"]
     ovislink [address = "10.4.14.228"]
 }
 network CompartirEsBueno-IPv6 {
     address = "2a00:1508:1:f00f::1/64"
     aleosi [address = "::1"]
     caipiroska [address = ":a9f9:af72:93a2:c94c"]
     leosia [address = ":6670:2ff:fe3d:9173"]
 }
 network CompartirEsBueno-IPv4 {
     address = "10.254.x.x/16"
     aleosi [address = "10.254.104.161"]
     caipiroska [address = "10.254.104.182"]
     eosial [address = "10.254.111.107"]
     leosia [address = "10.254.47.64"]
     sialeo [address = "10.254.157.127"]
 }
 network linklocal-wan {
     address = "fe80::"
     aleosi [address = "::a2f3:c1ff:fe9d:2579"]
     eosial [address = "::fad1:11ff:fe7a:61b3"]
 }
 network linklocal-wlan {
     address = "fe80::"
     caipiroska [address = "::1e4b:d6ff:fed2:f99"]
     aleosi [address = "::a0f3:c1ff:fe9d:257a"]
     eosial [address = "::f8d1:11ff:fe7a:61b4"]
     leosia [address = "::6470:2ff:fe3d:9175"]
     sialeo [address = "::90f6:52ff:fe6a:7dee"]
 }
 network librenet6 {
     address = "fe80::"
     aleosi [address = "::c8e1:c2ff:fe9c:cfe4"]
 }
 network librevpn {
     address = "192.168.9.x/24"
     caipiroska [address = "192.168.9.70"]
 }
 network linklocal-lan {
     address = "fe80::"
     aleosi [address = "::a2f3:c1ff:fe9d:2577"]
     eosial [address = "::fad1:11ff:fe7a:61b1"]
     leosia [address = "::68d3:ecff:fefb:d060"]
     osiale [address = "::214:85ff:fe3c:5a9f"]
     sialeo [address = "::92f6:52ff:fe6a:7dec"]
 }
}

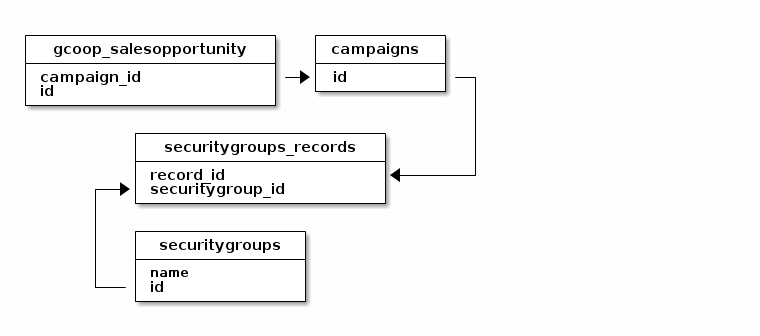
ditaa
+------------------------+   +------------+
| gcoop_salesopportunity |   | campaigns  |
+------------------------+   +------------+
| campaign_id            |-->| id         |--+
| id                     |   +------------+  |
+------------------------+                   |
                                             |
           +------------------------+        |
           | securitygroups_records |        |
           +------------------------+        |
           | record_id              |<-------+
       +-->| securitygroup_id       |
       |   +------------------------+
       |
       |   +----------------+
       |   | securitygroups |
       |   +----------------+
       |   | name           |
       +---| id             |
           +----------------+
gnuplot
graphviz
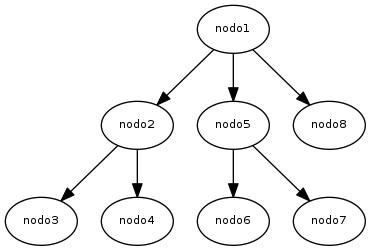
dot
digraph dot {
   node [fontname=monospace,fontsize=8];
   nodo1 -> nodo2;
   nodo2 -> nodo3;
   nodo2 -> nodo4;
   nodo1 -> nodo5;
   nodo5 -> nodo6;
   nodo5 -> nodo7;
   nodo1 -> nodo8;
}
neato
graph dot {
   node [fontname=monospace,fontsize=8];
   nodo1 -- nodo2;
   nodo2 -- nodo3;
   nodo2 -- nodo4;
   nodo1 -- nodo5;
   nodo5 -- nodo6;
   nodo5 -- nodo7;
   nodo1 -- nodo8;
}
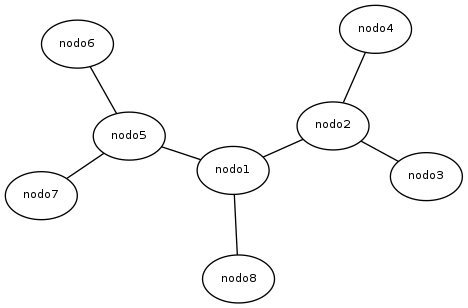
image-magick
org-timeline
org-clock 2014-02-04 | org-timeline
13:    14:    15:    16:    17:    18:
  ┊      ┊      ┊      ┊      ┊      ┊
  ┊□□□□□□┊□□▣▣▣▣┊□□□□□□┊□▨▣▣▣▣┊□□□□□□┊        gca ===============>  133
  ┊□□□□▣▣┊□□□□□□┊□□□□□□┊□□□□□□┊□□□□□□┊   almuerzo ===============>   38
  ┊      ┊      ┊      ┊      ┊      ┊      TOTAL ===============>  171
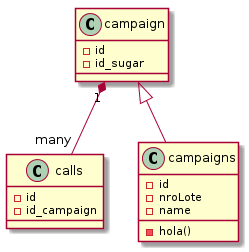
plant-uml
Diagramas de Clase
campaign "1" *-- "many" calls
    campaign <|-- campaigns

class campaign {
    -id
-id_sugar
    }

class calls {
    -id
-id_campaign
    }

class campaigns {
    -id
-nroLote
    -name
    -hola()
    }
Diagramas de Secuencia
skinparam sequenceParticipantFontName Monospaced
skinparam sequenceParticipantBorderColor black
skinparam sequenceLifeLineBorderColor black
skinparam sequenceArrowFontName Monospaced
skinparam sequenceArrowColor blue

participant "firefox\n1.2.3.4:4321" as firefox #orange
participant "proxy\n2.2.2.2" as proxy #green
participant "DNS\n8.8.8.8:53" as DNS #yellow
participant "google.com\n6.6.6.6:80" as google #red
hide footbox
autonumber "<b>[0]"

firefox -> DNS: cuál es la IP de <b>google.com</b>
DNS -> DNS: log
DNS --> firefox: es la IP <b>6.6.6.6</b>
firefox -> google: mi IP es <b>1.2.3.4</b> + UserAgent + GET /
google -> google: log
google --> firefox: HTML

gnuplot
desde un archivo de datos
head ~/data/bcc/gca/asterisk/asterisk1-bean-query-20.dat
 1	1.4569969177246	11.918306112289
 2	1.2775399684906	3.2772920131683
 3	1.1570041179657	2.124370098114
 4	1.2286741733551	2.1695129871368
 5	1.1820800304413	2.1903049945831
 6	1.3336930274963	1.7454440593719
 7	1.2775030136108	1.8959369659424
 8	1.2779738903046	2.9318058490753
 9	1.6264469623566	2.3969349861145
10	1.280650138855	2.1734149456024
load '~/bin/osiux.plt'
set lmargin 10
set rmargin 10
set bmargin 10
set title "sqlsoap server bean vs query" font "Inconsolata,28" tc lt 5
set xlabel "requests" font "Inconsolata,14"
set ylabel "tiempo en segundos" font "Inconsolata,14"
set tics out nomirror
set grid ytics
set xtics font "Inconsolata,10" nomirror
set ytics nomirror
set tics font "Inconsolata,10" nomirror
set mytics

plot data using 1:2 with lines lw 3 lt 3 title 'bean', \
     data using 1:3 with lines lw 3 lt 4 title 'query'

procesar un log, generar el archivo y graficar
cd ~/blog
grep "0895.*Query Execution Time:[0-9\.]+" sugarcct6.log | awk '{print $4"\t"$9}' | sed s/"Time:"//g | awk '{if ($2>h[$1]) h[$1]=$2} END {for (hh in h) print hh,h[hh]}' | sort  | tee 0895-query-execution-time.dat
| 12:17:08 | 0.0302698612213 |
| 12:17:11 | 0.00952696800232 |
| 12:17:21 | 0.0434710979462 |
| 12:17:22 | 0.01877784729 |
| 12:17:25 | 0.0104238986969 |
| 12:17:26 | 0.0150380134583 |
| 12:17:28 | 1.61865592003 |
| 12:17:29 | 0.022381067276 |
| 12:17:30 | 0.00826001167297 |
| 12:17:50 | 0.00913214683533 |
| 12:17:51 | 0.0108060836792 |
load '~/bin/osiux.plt'
set lmargin 10
set bmargin 10
set rmargin 10
set title "Máximo Tiempo de ejecución Queries usuario 0895\nsugarcct6.log" font "Inconsolata,18" tc lt 5
set xdata time
set timefmt "%H:%M:%S"
set format x "%H:%M:%S"
set xtics font "Inconsolata,12" rotate
set mxtics
set key off
set tics font "Inconsolata,12" nomirror
set mytics
set grid ytics
set xlabel "horario" font "Inconsolata,14"
set ylabel "tiempo en segundos" font "Inconsolata,14"

plot data u 1:2 lw 8 w i
